A quick at-a-glance way to get an idea of just how much traffic is flowing in an Azure Web App is to pin the statistics to the Dashboard.
Azure Web App: Server requests statistics
To do so is a fairly simple process.
- Log on to the Azure Portal
- Click on the Web App in question
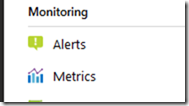
- Scroll the left hand column down to Metrics
- Click on RESOURCE to bring up the Select a resource blade
- Choose the Analytics resource
- Click the Apply button
- Scroll the METRIC dropdown to SERVER and choose Server Requests
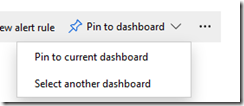
- Click the Pin to dashboard button
- A choice can be made to pin to the current or another Dashboard
Once done, we have a great view of our Azure Web App!
Thanks for reading!
Philip Elder
Microsoft High Availability MVP
MPECS Inc.
www.s2d.rocks !
Our Web Site
Our Cloud Service


